Edge Bundling Security Groups Redux
You can now visualise your own EC2 security groups using edge bundling - No scripts, no downloads!
This small web application takes an AWS access key id and secret access key to make requests against your AWS account. The application doesn't store your credentials remotely; it stores the keys locally, and only uses them to query the AWS API. Don't just take my word for it, you can see all the code on GitHub.
I've included video instructions below to create a one-time, read-only IAM user to generate keys below. While keys are definitely not my preferred way to access the AWS APIs (because long-lived keys, etc) it's the quickest and easiest way to make the application accessible to everyone.
The Original
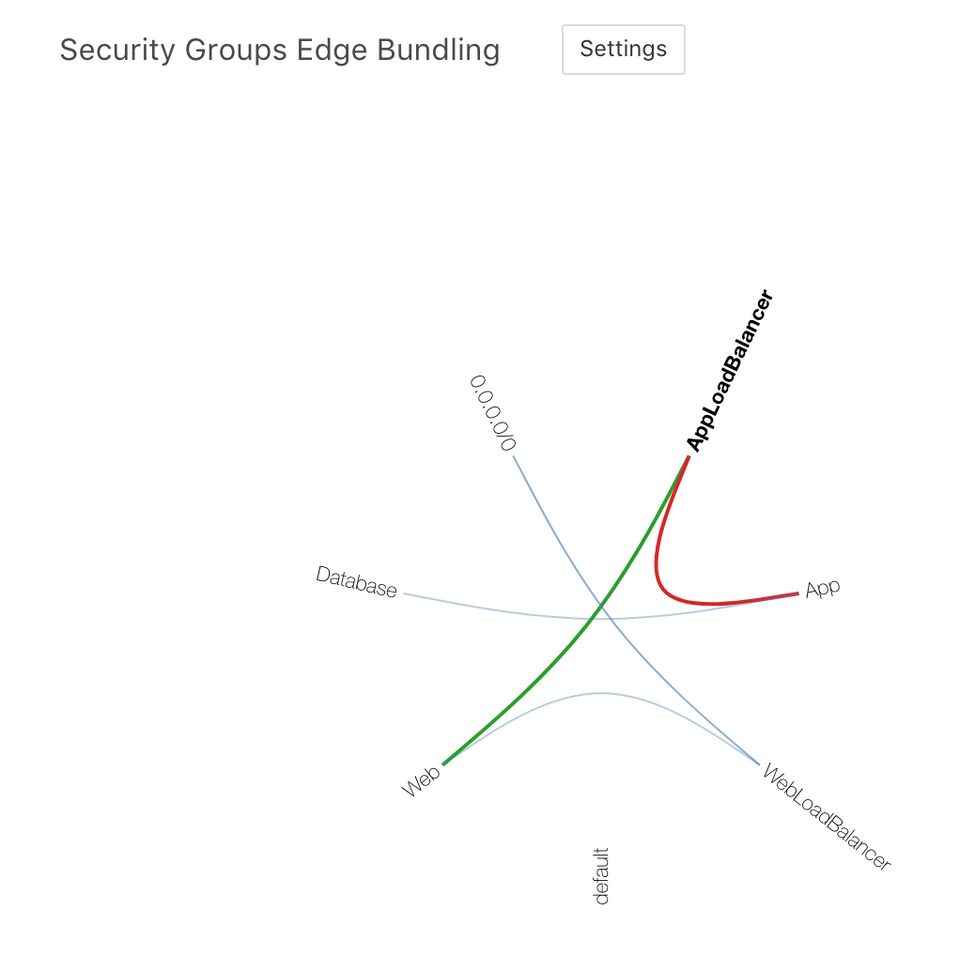
One of the most popular blog posts I've done was about visualising EC2 security groups using D3.js's hierarchical edge bundling technique.
My original post was limited because the security group data had to be massaged in to a format that D3.js could handle, and I wrote a bunch of my own ETL scripts to do just that.
The post was long enough that I just released it without trying to explain the ETL scripts (that were a bit kludgy). Over the last year many people have emailed me to get those scripts, so I thought I'd (finally) get around to making it self-service.
I also included a CloudFormation template to generate the security groups, as recommended by the AWS architecture pattern detailed in the original post.
Read-only IAM User
While my application doesn't do anything naughty, I really hope you don't get in to the habit of using access keys that have serious access to your account in 3rd party applications. At the very least you should be creating a one-time, read-only IAM user to grant access. The video below goes through the process:
While the video uses the EC2ReadOnly managed policy, you could hand-craft a policy with just ec2:DescribeSecurityGroups to really lock it down.
Next Steps
I'd really like to tweak and customise the visualisation itself to give more information. I'm just not sure if edge bundling is the best way to do it. If you've got any suggestions on how to show the data, let me know in the comments below!
If you discover any issues with the visualisation, please open an issue on the project (or better yet, just send a PR!).